-
Notifications
You must be signed in to change notification settings - Fork 257
How to monitor Kafka and AutoMQ
Author: Xu Qingkang, Solutions Director at Beijing Boland Company
When using software, we often ask how to monitor it and what metrics to monitor. Monitoring Kafka has been a long-standing challenging issue, as the community has not put significant effort into monitoring. To implement a comprehensive Kafka monitoring framework, it should at least include monitoring of the host resources where Kafka resides, the JVM (since Kafka Broker is essentially a Java process), and the Kafka cluster itself. Additionally, monitoring the Kafka cluster should also involve paying attention to the performance of its client programs.
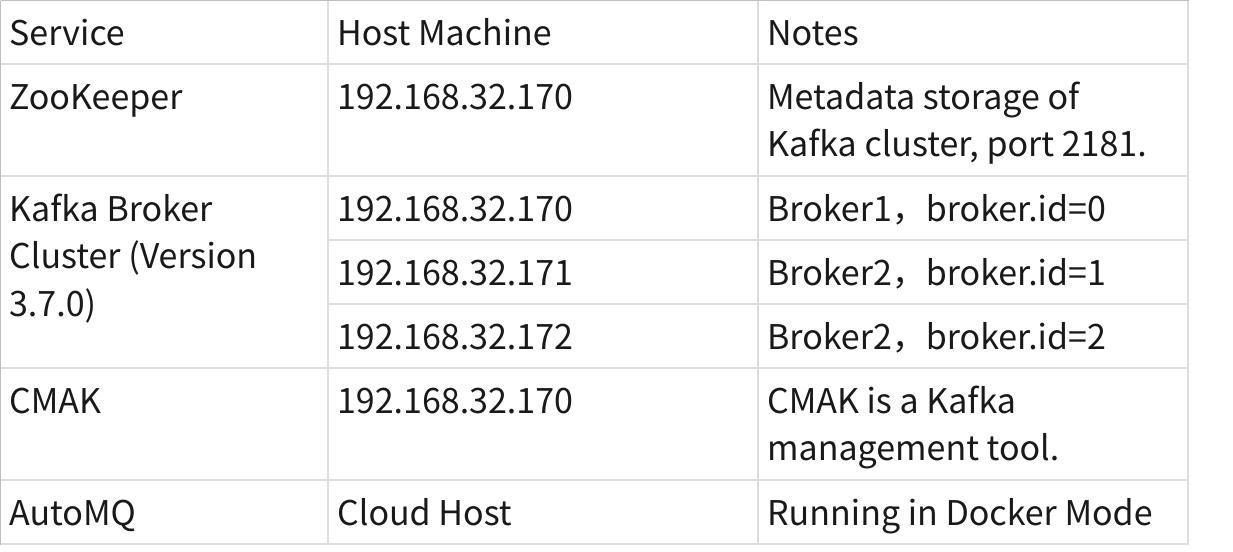
This article focuses on monitoring Kafka and AutoMQ clusters. For host monitoring and JVM monitoring, you are probably already very familiar. To better explain, we will first briefly introduce the verification environment involved, which includes dependency components like ZooKeeper, the Kafka/AutoMQ clusters themselves, and the CMAK monitoring service.
For simplicity, ZooKeeper runs as a single instance. The Kafka Broker, however, uses three hosts to build a real cluster. CMAK, formerly known as Kafka Manager, is the new name for the tool. This open-source software, contributed by Yahoo, is used to manage Kafka. When I first saw CMAK, it reminded me of the cross-platform compilation tool “CMake”.
According to Kafka's official documentation, you can obtain Kafka's metrics information through JMX. Refer to [Kafka Documentation](https://kafka.apache.org/documentation/\#monitoring). JMX stands for “Java Management Extensions”, which is a framework for monitoring and managing Java applications. It was once very popular and used in many JavaEE application server middleware, including the famous WebLogic, for configuration management and monitoring. Many scenarios involving the use of Zabbix monitoring software for application server middleware are also done through JMX. Key points of JMX technology include:
-
- In the JVM system, objects that need to be managed or monitored are called MBeans (Managed Beans). We don't need to worry about whether it's a standard MBean, dynamic MBean, or model MBean; essentially, it's just a regular Java object.
-
- Each MBean is identified by an ObjectName, which is usually a combination of multiple key-value pairs.
-
- Items that need to be managed and monitored are exposed as Attributes.
Taking Kafka as an example, if you need to get statistics on the number of messages enqueued in a Topic, you need to check the MBean with ObjectName “kafka.server:type=BrokerTopicMetrics,name=MessagesInPerSec,topic=mainTopic1”. This MBean has attributes like “Count”, “OneMinuteRate”, “FiveMinuteRate”, and “FifteenMinuteRate” representing “total number of messages”, “enqueue rate in the past 1 minute”, “enqueue rate in the past 5 minutes”, and “enqueue rate in the past 15 minutes” respectively.
Kafka does not enable JMX by default, so you need to set the JMX_PORT environment variable before starting Kafka to enable JMX.
#!/bin/sh
KAFKA_HOME=/home/xuqingkang/kafka-3.7.0
export KAFKA_HEAP_OPTS=" -Xms6g -Xmx6g"
export JMX_PORT="19009"
export KAFKA_JVM_PERFORMANCE_OPTS=" -server -XX:+UseG1GC -XX:MaxGCPauseMillis=20 -XX:InitiatingHeapOccupancyPercent=35 -XX:+ExplicitGCInvokesConcurrent -Djava.awt.headless=true"$KAFKA_HOME/bin/kafka-server-start.sh -daemon
$KAFKA_HOME/config/server.properties
When the JMX_PORT environment variable is set, the Kafka startup script uses the -D flag to set several JMX-related properties, such as "-Dcom.sun.management.jmxremote", thereby enabling JMX support.
>cat kafka-run-class.sh
# JMX settings
if [ -z "$KAFKA_JMX_OPTS" ]; then
  KAFKA_JMX_OPTS="-Dcom.sun.management.jmxremote -Dcom.sun.management.jmxremote.authenticate=false  -Dcom.sun.management.jmxremote.ssl=false "
fi
# JMX port to use
if [  $JMX_PORT ]; then
   KAFKA_JMX_OPTS="$KAFKA_JMX_OPTS -Dcom.sun.management.jmxremote.port=$JMX_PORT "
   if ! echo "$KAFKA_JMX_OPTS" | grep -qF -- '-Dcom.sun.management.jmxremote.rmi.port=' ; then
    # If unset, set the RMI port to address issues with monitoring Kafka running in containers
    KAFKA_JMX_OPTS="$KAFKA_JMX_OPTS -Dcom.sun.management.jmxremote.rmi.port=$JMX_PORT"
  fi
fi
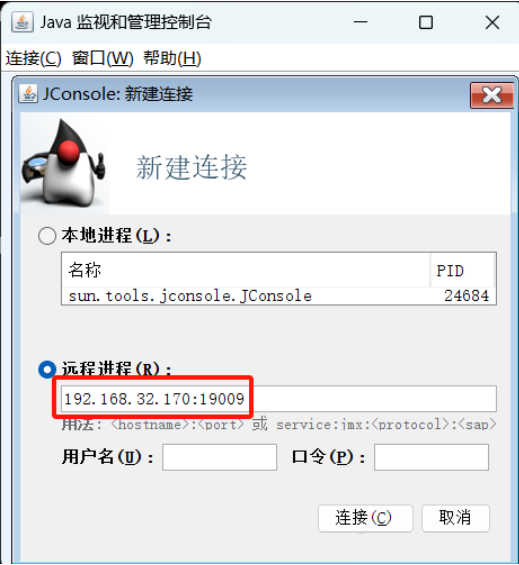
When the Kafka Broker has JMX enabled, you can connect using the JConsole tool provided with the JDK. Open jconsole and specify the IP address and port remotely to connect.
Once connected in JConsole, you can view many exposed MBeans on the MBean tab to monitor Kafka data. The following is an MBean to get the status of the Kafka Broker.
In some environments, it may not be possible to use the JConsole GUI. In such cases, you can implement a Java class to obtain Kafka monitoring information. The custom Java class can run without depending on any jars other than the JDK, which is very convenient. The main logic of the Java code is to connect to the MBeanServer.
By connecting to the MBeanServer, you can query MBeans and retrieve attributes. The following code sample primarily queries all LogEndOffset MBeans on the Kafka Broker to get the LogEndOffset for each Topic partition.
import javax.management.*;
import javax.management.remote.JMXConnector;
import javax.management.remote.JMXConnectorFactory;
import javax.management.remote.JMXServiceURL;
import java.io.IOException;
import java.net.MalformedURLException;
import java.util.HashMap;
import java.util.Map;
import java.util.Set;

/**
 * Created by qingkang.xu on 2024/6/2.
 */
 public class KafkaJMXMonitor {

     private static MBeanServerConnection conn;

     //Set the JMX connection information for Kafka Broker, including host ip and JMX_PORT.
     private static String ipAndPort = "192.168.32.170:19009";

     public static void main(String[] args) {
         // 1、Initialization, obtain Kafka JMX MbeanServer connection
         if(!init()){
              return;
         }

         // 2、Obtain the LogEndOffset MBean of all topic partitions in Kafka through regular expressions.
         Set<ObjectName> objectNames = null;
         try {
             // For each topic in Kafka, every partition corresponds to an MBean. Set both the topic and partition as "*" for fuzzy search.
             ObjectName logOffsetObjName = new ObjectName(
                "kafka.log:type=Log,name=LogEndOffset,topic=*,partition=*");
              objectNames = conn.queryNames(logOffsetObjName,null);
         } catch (MalformedObjectNameException e) {
            e.printStackTrace();
            return;
         } catch (IOException e) {
            e.printStackTrace();
            return;
         }

         if(objectNames == null){
             return;
         }

         //  3、Obtain the LogEndOffset MBean information corresponding to each topic partition, and get the LogEndOffset.
         for(ObjectName objName:objectNames){
             String topicName = objName.getKeyProperty("topic");
             //  __consumer_offsets is a dedicated topic for Kafka to store client offsets, ignore.
             if("__consumer_offsets".equals(topicName)){
                 continue;
             }

             int partId = Integer.parseInt(objName.getKeyProperty("partition"));
             try{
                 Object val = conn.getAttribute(objName,"Value");
                 if(val !=null){
                     System.out.println("{topicName:" + topicName + ",partition:" + partId + ",LogEndOffset:" + val);
                  }
             }catch (Exception e) {
               e.printStackTrace();
               return;
             }
          }
      }

    //  Initialize JMX MBeanServer connection
    public static boolean init(){
        String jmxURL = "service:jmx:rmi:///jndi/rmi://" +ipAndPort+ "/jmxrmi";
        System.out.println("Init JMX, jmxUrl: {" + jmxURL + "}, and begin to connect it");
        try {
             JMXServiceURL serviceURL = new  JMXServiceURL(jmxURL);
             JMXConnector connector = JMXConnectorFactory.connect(serviceURL,null);
             conn = connector.getMBeanServerConnection();
             if(conn == null){
                 System.err.println("Get JMX Connection Return Null!");
                 return  false;
              }
          } catch (MalformedURLException e) {
             e.printStackTrace();
             return false;
          } catch (IOException e) {
              e.printStackTrace();
              return false;
          }
          return true;
    }
}
The compiled and running results of the above code are similar to the following: From the results, it can be seen that the Broker has 3 Topics, each with two partitions, and the LogEndOffset for each partition is successfully retrieved.
[xuqingkang@rhel75-170 jmx-client]$ javac KafkaJMXMonitor.java
[xuqingkang@rhel75-170 jmx-client]$ java -cp . KafkaJMXMonitor
Init JMX, jmxUrl: {service:jmx:rmi:///jndi/rmi://192.168.32.170:19009/jmxrmi}, and begin to connect it
{topicName:mainTopic1,partition:0,LogEndOffset:23
{topicName:mainTopic2,partition:2,LogEndOffset:0
{topicName:mainTopic2,partition:0,LogEndOffset:8
{topicName:mainTopic3,partition:0,LogEndOffset:0
{topicName:mainTopic3,partition:2,LogEndOffset:0
{topicName:mainTopic1,partition:1,LogEndOffset:6
As previously mentioned, the monitoring experience is not very user-friendly. This is where CMAK comes into play. By following a few steps, you can achieve an intuitive B/S architecture for Kafka monitoring.
- Retrieve CMAK from GitHub via git:
git clone /~https://github.com/yahoo/CMAK.git
- Compile and configure CMAK
The compilation and build of CMAK can be done using sbt, a build tool specifically for Scala projects, similar to well-known tools like Maven and Gradle. However, before the actual compilation and build, ensure you have JDK version 11 or above as required by the official documentation. Therefore, before running sbt, correctly set the path for JDK version 11 or higher, as shown in the following command:
PATH=/home/xuqingkang/jdk-14.0.2/bin:$PATH \
JAVA_HOME=/home/xuqingkang/jdk-14.0.2 \
/home/xuqingkang/CMAK/sbt -java-home /home/xuqingkang/jdk-14.0.2 clean dist
If everything goes smoothly, you will see a message saying "Your package is ready in" indicating the path where the compiled CMAK is located, as shown below:
......
[info] Compiling 140 Scala sources and 2 Java sources to /home/xuqingkang/CMAK/target/scala-2.12/classes ...
[info] LESS compiling on 1 source(s)
model contains 662 documentable templates
[info] Main Scala API documentation successful.
[success] All package validations passed
[info] Your package is ready in /home/xuqingkang/CMAK/target/universal/cmak-3.0.0.7.zip
[success] Total time: 114 s (01:54), completed 2024年6月2日 上午10:39:58
Use the unzip command to extract target/universal/cmak-3.0.0.7.zip. After extraction, modify the conf/application.conf file and change cmak.zkhosts to the actual zookeeper address.
cmak.zkhosts="192.168.32.170:2181"
Finally, you can start CMAK directly using its script. Since there are multiple versions of JDK in the author's environment, the "-java-home" option was specifically used to designate JDK version 14 to meet the requirement of JDK version 11 or higher.
nohup ./bin/cmak -java-home /home/xuqingkang/jdk-14.0.2/ &
- CMAK Operation and Basic Usage
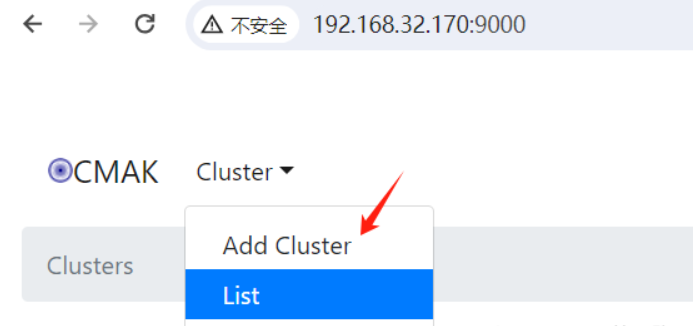
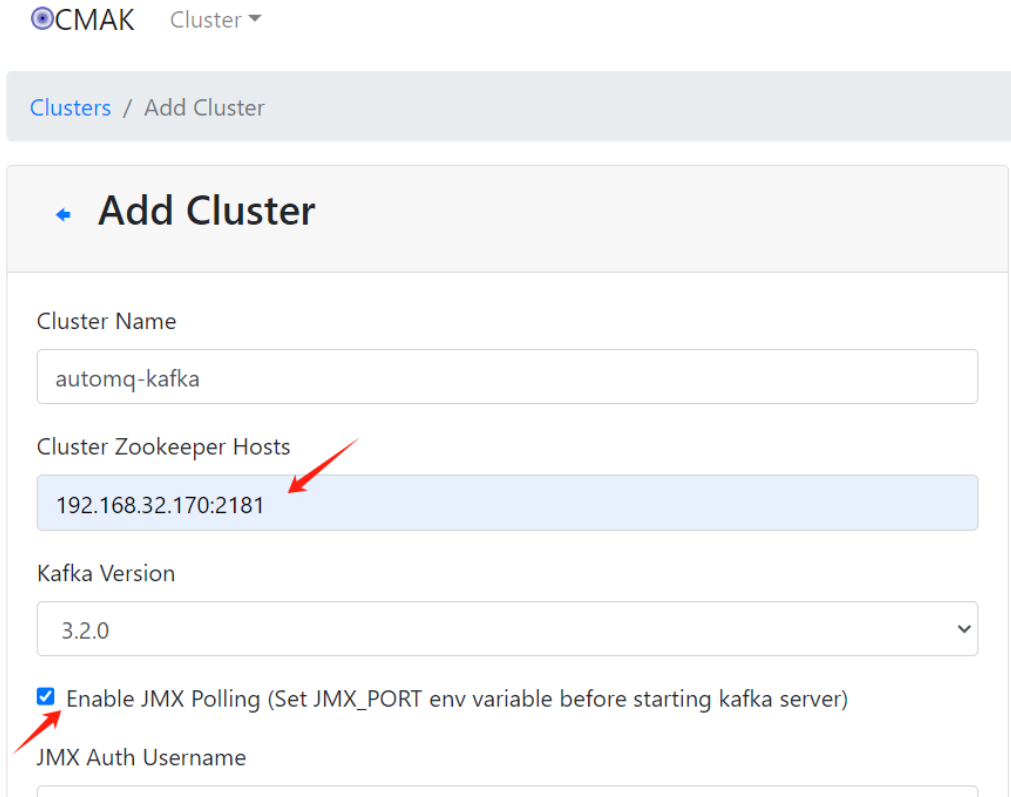
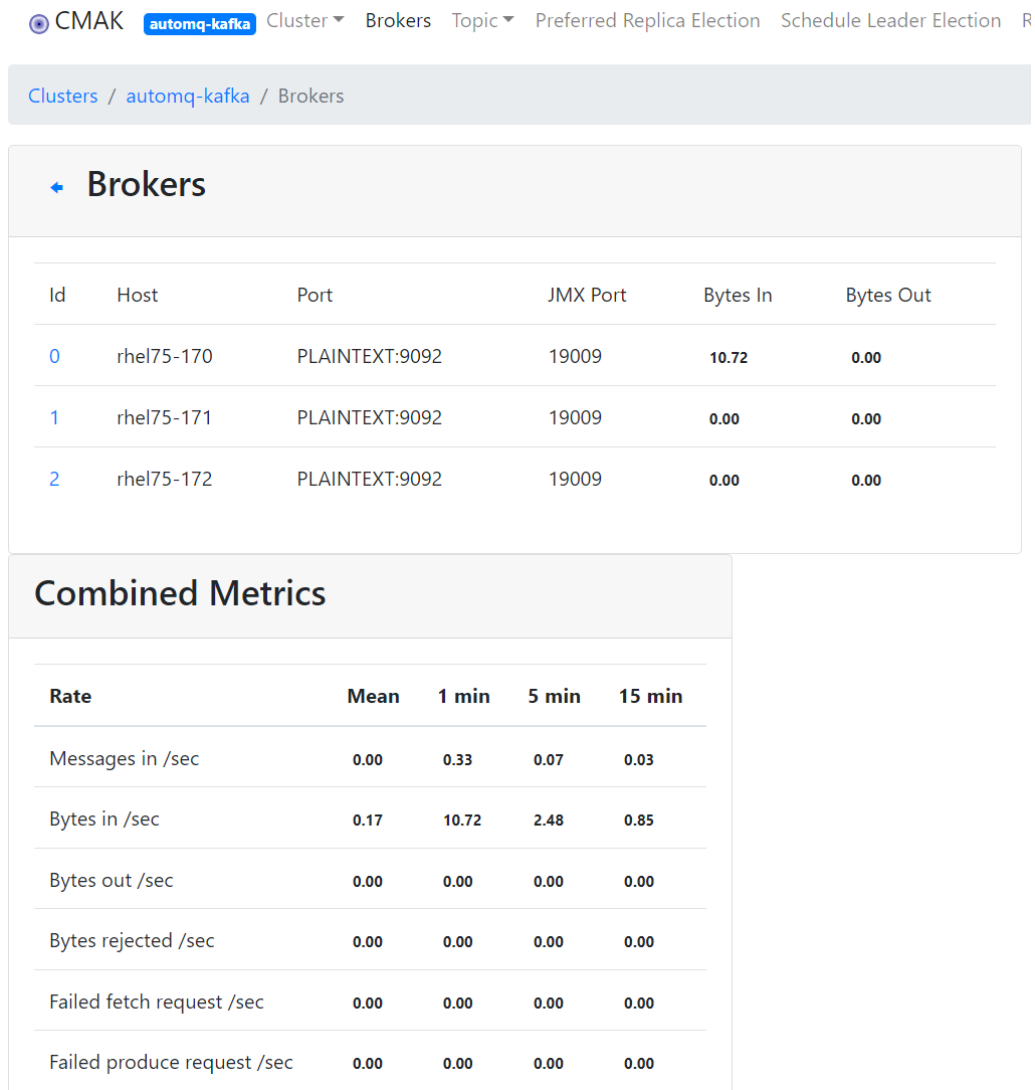
The default port for CMAK is 9000, but it can be modified using the "-Dhttp.port" option during startup. For example, "cmak -Dhttp.port=8080". Once the startup is complete, you can access it via a web browser. Upon seeing the CMAK interface, the first step is to click on the "Cluster" menu and select "Add Cluster" to input the information of the Kafka clusters you need to manage.
When adding a Kafka cluster, the most important piece of information is setting the "Cluster Zookeeper Hosts" option, ensuring it matches the actual ZooKeeper hosts of the Kafka cluster. The "Enable JMX Polling" option is necessary for obtaining "Combined Metric" metrics, and it requires setting the JMX_PORT environment variable when starting the Kafka Broker to enable JMX monitoring.
If everything is set correctly, you can then select the created Kafka cluster from the cluster list for monitoring.
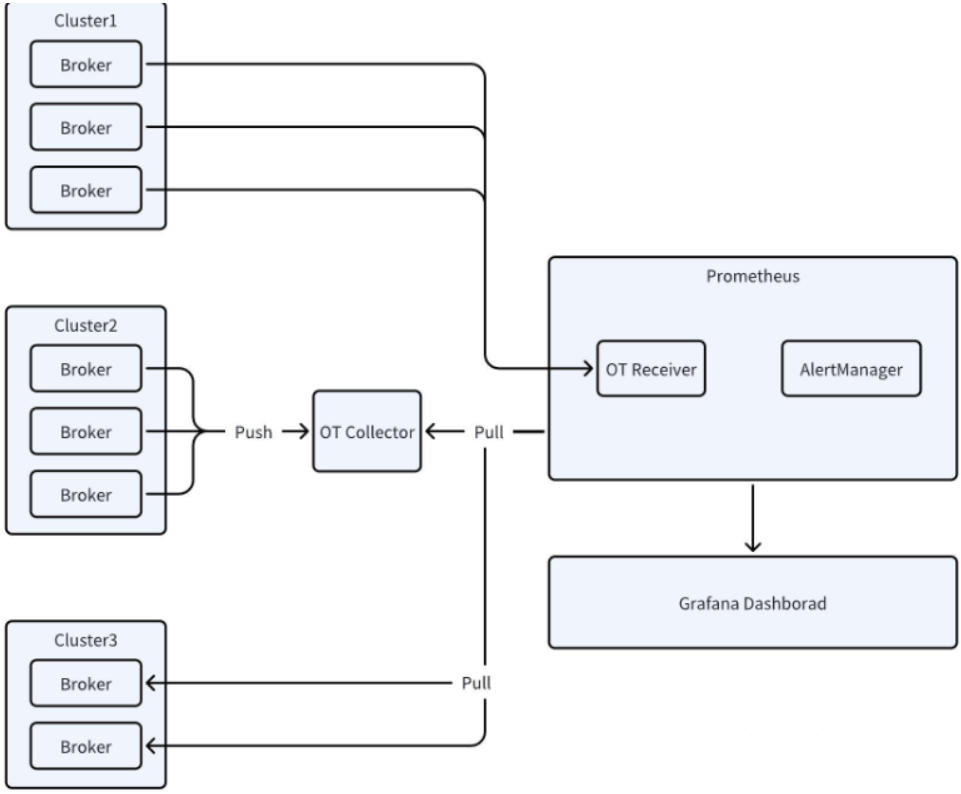
The official website of AutoMQ provides detailed guidance on integrating metrics for monitoring. As shown in the figure from the AutoMQ website, the roles of OT Receiver and OT Collector are added between the well-known Grafana+Prometheus combination, which essentially supports OpenTelemetry.
The monitoring architecture of Grafana+OpenTelemetry+Prometheus introduces OT Collector and OT Receiver to allow Kafka/AutoMQ services to act as monitored objects that can directly push their metrics information. The OT Collector can perform data filtering, aggregation, transformation, and export data to multiple backends, which is the mainstream architecture for building cloud-native large-scale monitoring today.
Follow the steps below to set up Grafana, OTel Collector, and Prometheus services, and integrate Kafka/AutoMQ's Controller and Broker into the monitoring system.
In the source code of AutoMQ (link: /~https://github.com/AutoMQ/automq), there are scripts and configuration samples for building monitoring services located in the docker/telemetry/ directory. You can directly run "install.sh start". This script primarily uses docker-compose to run services like Grafana, Prometheus, and OTel Collector as Docker containers. Below is a snippet of the core code and configuration:
>cat install.sh //直接调用docker compose启动容器
start_containers() {
  docker compose -f ./docker-compose.yaml up -d
  echo "Done."
}
The docker-compose.yaml contains the container startup configurations for services such as Grafana and Prometheus.
>cat docker-compose.yaml
version: '3'
services:
  grafana:
    image: grafana/grafana-enterprise
    container_name: grafana
    ......
    extra_hosts:
      - "host.docker.internal:host-gateway"
  prometheus:
    image: prom/prometheus
    ports:
      - 9090:9090
    ......
    extra_hosts:
      - "host.docker.internal:host-gateway"
  alertmanager:
    image: prom/alertmanager
    ports:
      - "9087:9087"
    ......
    extra_hosts:
      - "host.docker.internal:host-gateway"
  otel-collector:
    image: otel/opentelemetry-collector-contrib
    ......
      - 8890:8890 # Prometheus exporter metrics
      - 13133:13133 # health_check extension
      - 4317:4317 # OTLP gRPC receiver
      - 4318:4318 # OTLP http receiver
    extra_hosts:
      - "host.docker.internal:host-gateway"
After running "install.sh start", you can use docker ps on the current host to check if the monitoring service containers are running properly. If everything is normal, "http://ip:3000" should open the Grafana interface.
>docker ps
5af530eebd6c   grafana/grafana-enterprise                 "/run.sh"                33 hours ago     Up 33 hours       0.0.0.0:3000->3000/tcp, :::3000->3000/tcp                                                                                                                                                                                                                        grafana
21bbd335c5a3   prom/prometheus                            "/bin/prometheus --s…"   33 hours ago     Up 33 hours       0.0.0.0:9090->9090/tcp, :::9090->9090/tcp                                                                                                                                                                                                                        telemetry-prometheus-1
1914f31ef125   otel/opentelemetry-collector-contrib       "/otelcol-contrib --…"   33 hours ago     Up 33 hours       0.0.0.0:1888->1888/tcp, :::1888->1888/tcp, 0.0.0.0:4317-4318->4317-4318/tcp, :::4317-4318->4317-4318/tcp, 0.0.0.0:8888->8888/tcp, :::8888->8888/tcp, 0.0.0.0:8890->8890/tcp, :::8890->8890/tcp, 0.0.0.0:13133->13133/tcp, :::13133->13133/tcp, 55678-55679/tcp   telemetry-otel-collector-1
00cf4d65a6a1   phpmyadmin/phpmyadmin                      "/docker-entrypoint.…"   8 months ago     Up 3 days         0.0.0.0:19001->80/tcp, :::19001->80/tcp                                                                                                                                                                                                                          7218907947dc48c1
I have to say, I encountered quite a few issues here, but it turned out to be quite simple. The key is to add the metrics configuration to the Broker and Controller configuration files before starting them, so that the Broker and Controller can push monitoring data to the OTel Collector. Note that otlp.endpoint should be changed to the IP address of your actual environment, as Docker containers can directly access the host network. Here, the IP address of the host is used.
s3.telemetry.metrics.enable=true
s3.telemetry.metrics.exporter.type=otlp
s3.telemetry.exporter.otlp.endpoint=http://10.0.4.14:4317
When running in containerized form, it is recommended to make changes to the key configuration files based on the official image and then rebuild the "automqinc/automq" image. The specific steps are as follows:
- Build the directory, where the configuration files in the config directory are copied from the official image. Of course, you can also directly copy them from the GitHub source code.
[root@txcloud-centos8-1 addOTelinDocker]# tree
.
├── config
│   └── kraft
│       ├── broker.properties
│       ├── controller.properties
│       └── server.properties
├── Dockerfile
└── makeDocker.sh
2)、Add the "s3.telemetry..." configuration to the 3 properties files.
############################# Server Basics #####
# The role of this server. Setting this puts us in KRaft modeprocess.roles=broker
# The node id associated with this instance's roles
node.id=2

# The connect string for the controller quorum
controller.quorum.voters=1@localhost:9093
############################# Socket Server Settings #############################
#     listeners = PLAINTEXT://your.host.name:9092listeners=PLAINTEXT://localhost:9092
# The Prometheus HTTP server host and port, if exporter type is set to prometheus
# s3.metrics.exporter.prom.host=127.0.0.1
# s3.metrics.exporter.prom.port=9090
# The OTel Collector endpoint, if exporter type is set to otlp or tracing is enabled
# s3.telemetry.exporter.otlp.endpoint=http://${your_host_name}:4317
s3.telemetry.metrics.enable=true
s3.telemetry.metrics.exporter.type=otlp
s3.telemetry.exporter.otlp.endpoint=http://10.0.4.14:4317
3)、Complete the Dockerfile and makeDocker.sh script. The logic is quite simple: it involves overriding the configuration files on top of the official image and building a new image. Run the makeDocker.sh script locally to build the new image.
[root@txcloud-centos8-1 addOTelinDocker]# cat Dockerfile
# pull base image
# --------------
FROM automqinc/automq:latest

# Maintainer
# --------------
MAINTAINER support  <xuqingkang2@163.com>

COPY config/kraft/server.properties /opt/kafka/kafka/config/kraft/server.properties
COPY config/kraft/broker.properties /opt/kafka/kafka/config/kraft/broker.properties
COPY config/kraft/controller.properties /opt/kafka/kafka/config/kraft/controller.properties
[root@txcloud-centos8-1 addOTelinDocker]# cat makeDocker.sh
[root@txcloud-centos8-1 addOTelinDocker]# cat makeDocker.sh
#!/bin/sh
docker build --force-rm=true --no-cache=true -t automqinc/automq:latest -f Dockerfile .
Similarly, refer to the official AutoMQ documentation to quickly bring up the Broker and Controller services locally using Docker. Note that since the "automqinc/automq" image was already built locally in the previous step, docker-compose will use it.
curl https://download.automq.com/community_edition/standalone_deployment/install_run.sh | bash
The install_run.sh script provided by AutoMQ contains core logic to download the docker-compose.yaml file from the official website and use docker-compose to bring up the Broker and Controller. Here is an excerpt of the key code:
curl -O https://download.automq.com/community_edition/standalone_deployment/docker-compose.yaml
if [ ! -f "docker-compose.yaml" ]; then
    echo "[ERROR] Docker compose yaml file not exist."
        exit 4
fi
# Check if the current operating system is Linux
if [[ "$(uname)" == "Linux" ]]; then
    echo "Please enter your password for sudo:"
    sudo /usr/local/bin/docker-compose -f docker-compose.yaml up -d || exit 5
else
    docker-compose -f docker-compose.yaml up -d || exit 5
fi
The docker-compose.yaml file specifies how to start the Docker containers for core services like the Broker and Controller.
version: "3.8"
services:
  ......
  controller:    image: automqinc/automq:latest
  ......
  command:
    - bash
    - -c
    - |
      /opt/kafka/scripts/start.sh up --process.roles controller --node.id 0 --controller.quorum.voters 0@controller:9093 --s3.bucket automq-data --s3.endpoint http://10.6.0.2:4566 --s3.region us-east-1
  networks:
    - automq_net
  depends_on:
    - localstack
    - aws-cli
  broker1:
    image: automqinc/automq:latest
    ......
    command:
      - bash
      - -c
      - |
        /opt/kafka/scripts/start.sh up --process.roles broker --node.id 1 --controller.quorum.voters 0@controller:9093 --s3.bucket automq-data --s3.endpoint http://10.6.0.2:4566 --s3.region us-east-1

  broker2:
    ...broker1
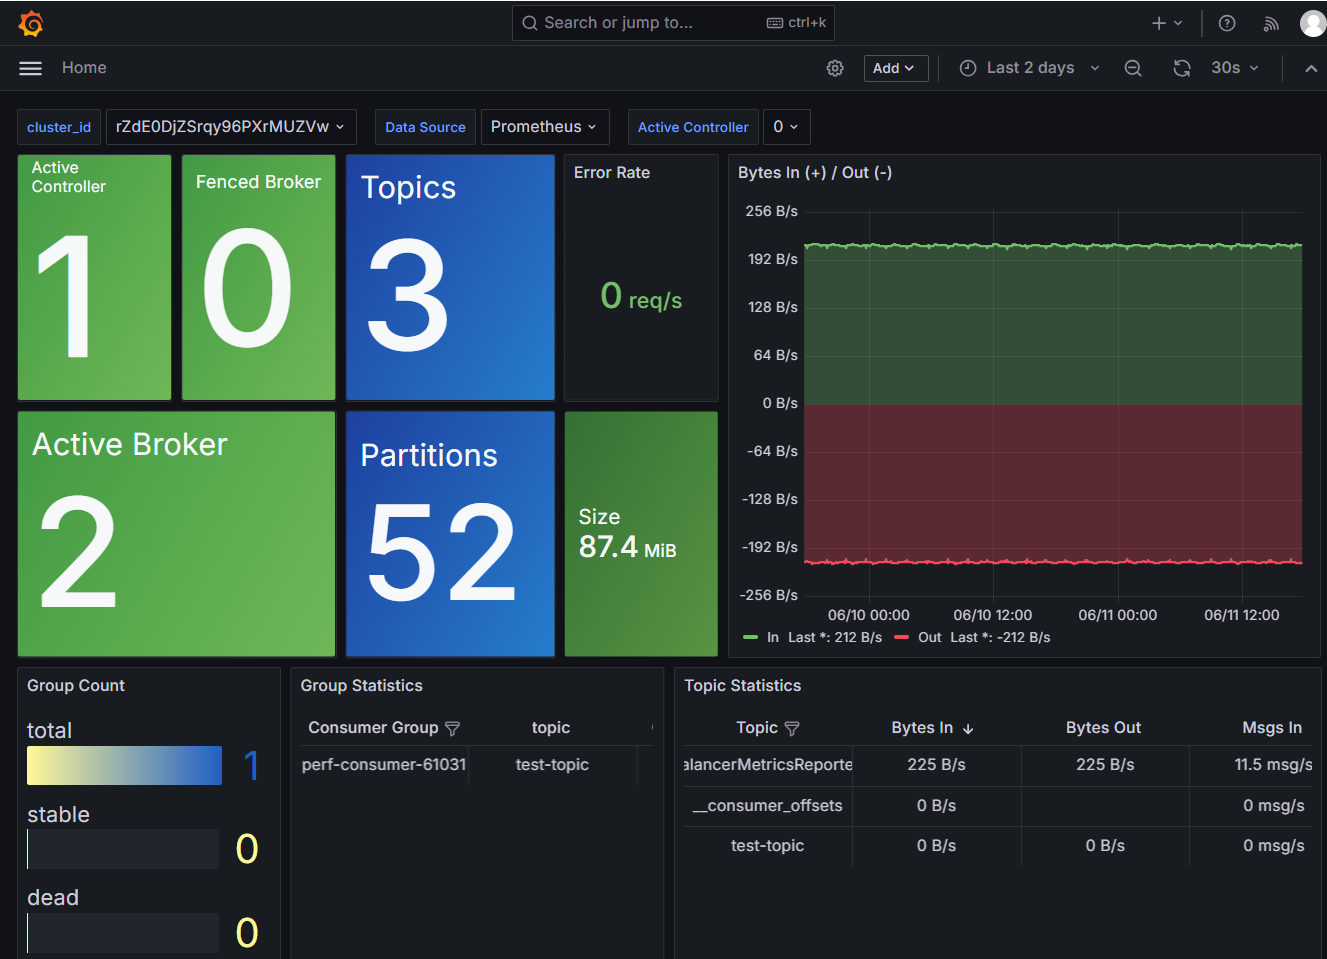
Finally, access Grafana through your browser to see AutoMQ monitoring data, including the number of Controllers, Brokers, Partitions, bytes sent/received per second, topics, consumer groups, and more.
- What is automq: Overview
- Difference with Apache Kafka
- Difference with WarpStream
- Difference with Tiered Storage
- Compatibility with Apache Kafka
- Licensing
- Deploy Locally
- Cluster Deployment on Linux
- Cluster Deployment on Kubernetes
- Example: Produce & Consume Message
- Example: Simple Benchmark
- Example: Partition Reassignment in Seconds
- Example: Self Balancing when Cluster Nodes Change
- Example: Continuous Data Self Balancing
-
S3stream shared streaming storage
-
Technical advantage
- Deployment: Overview
- Runs on Cloud
- Runs on CEPH
- Runs on CubeFS
- Runs on MinIO
- Runs on HDFS
- Configuration
-
Data analysis
-
Object storage
-
Kafka ui
-
Observability
-
Data integration
