Home
The Google charts (svyGCharts) component is a simple wrapper for the google charts API (see https://developers.google.com/chart/).
Here is a little example. This code
var data = [
     ['Genre', 'Fantasy & Sci Fi', 'Romance', 'Mystery/Crime', 'General', 'Western', 'Literature',
          { role: 'annotation' }],
     ['2010', 10, 24, 20, 32, 18, 5, ''],
     ['2020', 16, 22, 23, 30, 16, 9, ''],
     ['2030', 28, 19, 29, 30, 12, 13, '']
];
var options = {
     width: 800,
     height: 600,
     legend: { position: 'top', maxLines: 3 },
     bar: { groupWidth: '75%' },
     isStacked: true
};
elements.svygooglecharts.drawChart('BarChart', data, options);
will create this chart
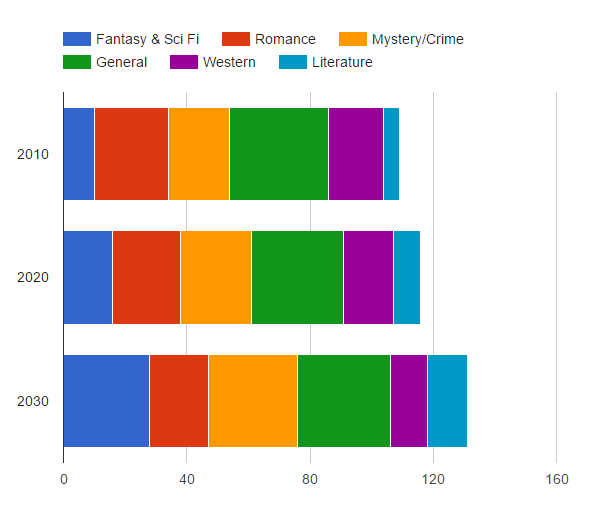
Table of contents
The component has the following properties:
| Property | Type | Default | Description |
|---|---|---|---|
| enabled | Boolean | true | The enable state of the component, default true. |
| readOnly | dataprovider | false | The readonly state of the component, default false. |
| styleClass | String | null | Additional style class(es) of the component |
| visible | Boolean | true | The visible property of the component, default true. |
ChartSelection is a component specific javascript type returned as an Array of such by getSelection or most of the events with the following properties:
| Property | Type | Description |
|---|---|---|
| row | Number | The row number of the selection |
| column | Number | The column number of the selection |
| value | Object | The value |
| Method | Params | Return | Description |
|---|---|---|---|
| drawChart | type:String, data:Array, options:Object | Draws a chart of the given type using the given data and options | |
| getSelection | Array<ChartSelection> | Gets the current selection of the chart as a ChartSelection array | |
| setSelection | row:Number, column:Number | Sets the selection of the chart of the given row and column | |
| setValue | row:Number, column:Number, value:Object | Sets the given value of the given row and column and updates the chart |
Draws a chart of the given type using the given data and options.
Params
| Type | Name | Description | Required |
|---|---|---|---|
| String | type | The chart type e.g. 'BarChart', 'ScatterChart', 'ColumnChart', 'PieChart' | Required |
| Array | data | The data to show | Required |
| Object | options | The chart options | Required |
Returns void
For chart types, the proper way to provide data and possible options see the documentation for the chart type you want at https://developers.google.com/chart/interactive/docs/quick_start.
As options you can provide exactly the options that a specific chart supports. There is one special property on the options that you can set called "firstRowIsData". That controls whether the first row of the data defines a header row or not. If true, all rows are assumed to be data. If false, the first row is assumed to be a header row, and the values are assigned as column labels. Default is false.
Gets the current selection of the chart as a ChartSelection array
Params none
Returns Array<ChartSelection>
Sets the selection of the chart of the given row and column
Params
| Type | Name | Description | Required |
|---|---|---|---|
| Number | row | row or null if the whole row should be selected | Required |
| Number | column | column or null if the whole column should be selected | Required |
Returns void
Sets the given value of the given row and column and updates the chart
Params
| Type | Name | Description | Required |
|---|---|---|---|
| Number | row | row number | Required |
| Number | column | column number | Required |
| Number | value | value | Required |
Returns void
| Event | Params | Return | Description |
|---|---|---|---|
| onDoubleClick | event:JSEvent, selection:Array<ChartSelection> | Called when a chart item is double clicked on. | |
| onError | event:JSEvent, errorCode:String, errorMessage:String | Called when an error occurs in the google chart library. | |
| onMouseOut | event:JSEvent, selection:Array<ChartSelection> | Called when the mouse leaves a chart item. | |
| onMouseOver | event:JSEvent, selection:Array<ChartSelection> | Called when the mouse enters a chart item. | |
| onSelect | event:JSEvent, selection:Array<ChartSelection> | Called when a chart item is selected. |