Track, display, and graph the position of a mouse cursor.
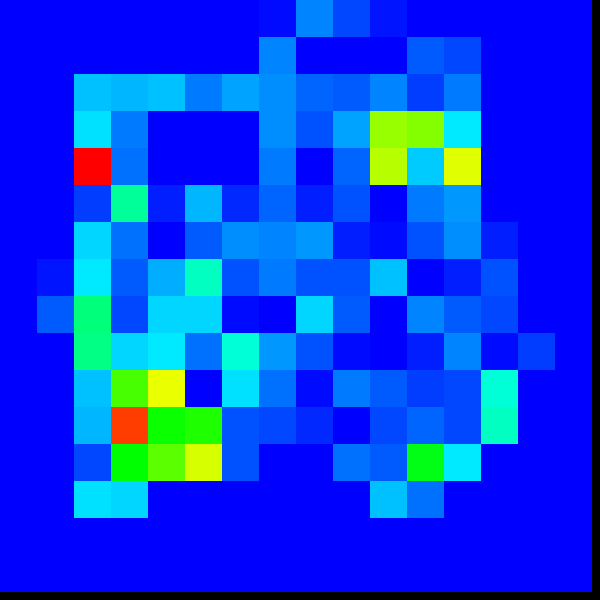
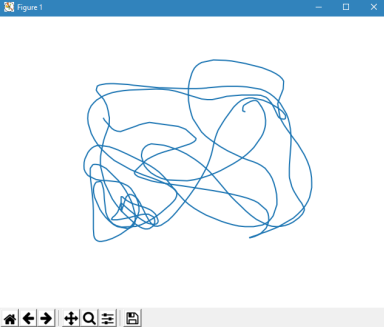
The application produces a heatmap and plots the mouse positions. Mouse Track is only available for Windows OS as it requires functions from the Windows API.
Python:
numpy==1.16.2
matplotlib==3.0.3
C++:
SDL2
- Install NumPy:
pip install numpy - Install Matplotlib:
pip install matplotlib - Install SDL2
- Clone, compile, and run:
$ git clone /~https://github.com/claby2/mouse-track.git
$ cd mouse-track
$ cd src
$ make run
- Move your mouse around your screen while the window is open.
- To end the capture, close the window.
- Positions of mouse are written into
data.csvin root folder - BMP heatmap is written into
heatmap.bmpin root folder
- Positions of mouse are written into
- Plot mouse positions based on
data.csv:
$ python graph.py
To run the application without writing into data.csv (for longer periods of tracking):
- In src:
make main source.exe --nosave
- In src:
make playback
- Graph will be saved as `graph.png` in root folder