Import RD signal for each sample from bam/sam/cram file, calculate histograms, partition and calls with specified bin size. It can be any positive integer divisible by 100. We use 10000 in this example:
> cnvpytor -root sample.pytor -rd sample.bam
> cnvpytor -root sample.pytor -his 10000
> cnvpytor -root sample.pytor -partition 10000
> cnvpytor -root sample.pytor -call 10000
Enter interactive plotting mode with all sample you want to plot listed:
> cnvpytor -root sample1.pytor sample2.pytor sample3.pytor sample4.pytor -view 10000

cnvpytor> set Q0_range -1 0.5              # filter calls with more than half not uniqly maped reads
cnvpytor> set p_range 0 0.0001             # filter non-confident calls
cnvpytor> set size_range 50000 inf         # filter calls smaller than 50kbp
cnvpytor> set dG_range 100000 inf          # filter calls close to gaps in reference genome (<100kbp)
cnvpytor> print merged_calls                # printing calls on screen
...
...
cnvpytor> set print_filename merged.xlsx    # Output filename
cnvpytor> set output_filename merged.png    # Prefix for graphical output files
cnvpytor> set annotate                     # Turn on annotation (optional - takes a lot of time)
cnvpytor> set plot                         # Turn on ploting for each calls (optional - takes a lot of time)
cnvpytor> print merged_calls                # Generate Excel output and png files with RD plots
cnvpytor> quit
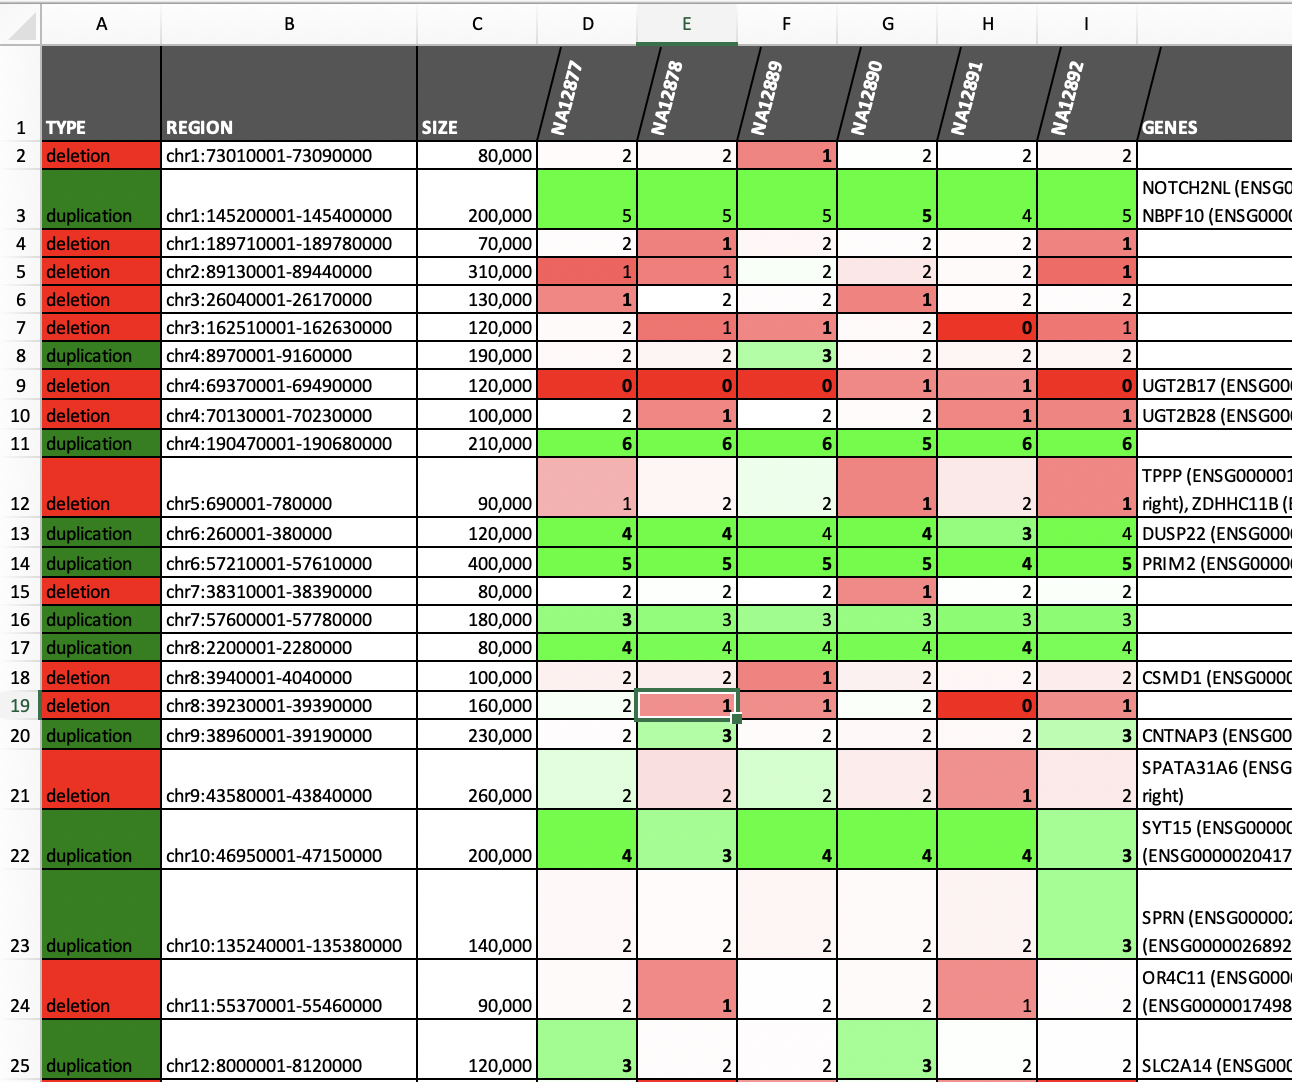
File merged.xlsx contains list Excel file with list of all calls merged over samples.
Files merged.regions.0000.png to merged.regions.0047.png contain RD region plots for all 48 calls. This could be used for manual filtering of false positive calls. This is an example of generated plot:
In this example we used data from Illumina Platinum Genomes.

