-
Notifications
You must be signed in to change notification settings - Fork 83
The logger
uBlock Origin comes with a logger, which gives the ability to inspect what uBlock₀ is doing with network requests and DOM elements, whether something is blocked or allowed, and which filter, if any, matched a network request or DOM element. This logger is unified, meaning it will display everything uBlock₀ does as it occurs.
The logger is the tool of choice to see, understand, diagnose and fix the functioning of uBlock₀.
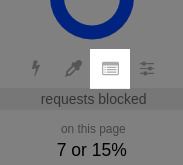
To access the logger, click on the list icon of uBlock Origin's popup UI:

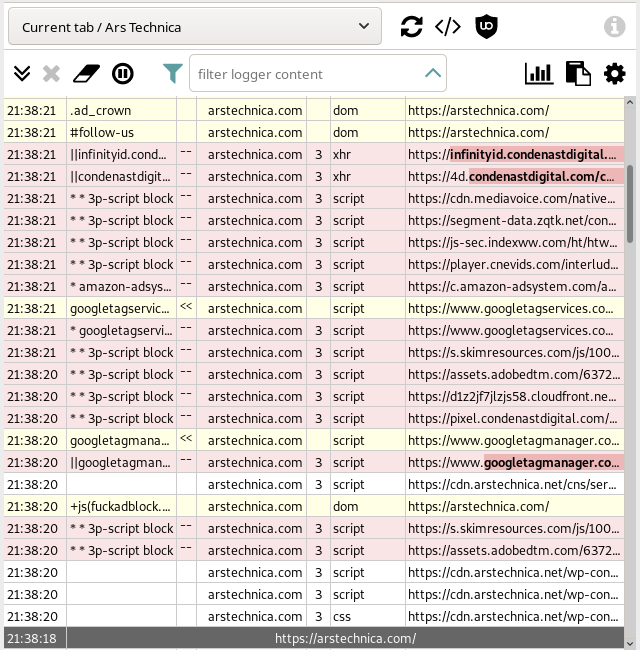
The request logger will open in a new tab (which was moved to its own window below):

The color of a row hints at how the resource was filtered:
- No color: The request for the resource was allowed to go through because it matched no filter/rule.
- Purple: The request for the resource was modified by one of the "Modifier filters".
- Red: The request for the resource was canceled (
--) because of a block filter/rule. - Gray: "Dynamic filtering"
nooprule. - Green: The request for the resource was allowed to go through (
++) because it matched a filter/rule whose purpose is to bypass a matching block filter/rule. - Yellow:
- A DOM element which was blocked by a cosmetic filter; OR
- A blocked request for a resource was redirected (
<<) to a local, "neutered" replacement resource. - A defuser scriptlet was injected into the page (
+js(...))
Particular columns indicate:
- Timestamp of the event
- For blocked/allowed/hidden resources, the column will contains the responsible filter. For redirection, local resource used as replacement to the blocked network request.
- Action taken by uBlock Origin:
-
--blocked request -
++allowed by exception filter/rule -
<<redirection to neutered resource
-
- Context identifier (domain) in which the filter is evaluated
-
Partyness of the network request related to main document, and optionally after comma, partyness of the request in relation to embedded subdocument
-
1for the first-party requests, from current page domain (the one you see in address bar) -
3for third-party requests, from other domains -
0for tabless requests (behind the scene, requests not assigned to any opened page)
-
- Type of request
- Address of the resource on which filter was applied
Time, Filter/Rule, Context and Partyness columns can be disabled in Settings dialog
Take note that the network request logger in uBlock₀ is a forward-looking logger: this means only future requests can be logged.
In the spirit of efficiency, uBlock₀ will log entries IF AND ONLY IF the logger is opened. Otherwise, if the logger is not opened, no CPU/memory resources are consumed by uBlock₀ for logging purpose.
Hold the Shift key while clicking the "Open the logger" icon to toggle between opening the logger in a separate window or in a separate tab. uBO will remember that setting when you open the logger next time, without having to hold the Shift key.
- Page selector
- Reload
- DOM inspector
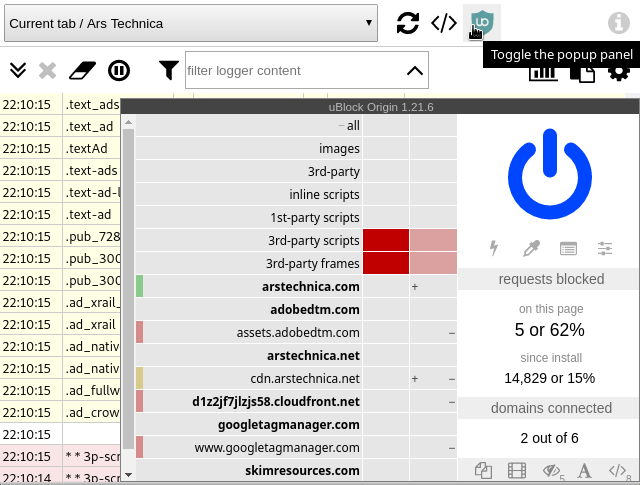
- Accessing popup UI of a specific page
- Expand
- Void log entries
- Clear
- Pause the logger
- Filtering the logger output
- Filter statistics
- Export dialog
- Settings dialog
- Finding from which list(s) a static filter originates
- Creating filters

The drop-down selector is to display log entries which are related to a specific page. This will hide from view all log entries which are not related to the selected page. By selecting All again, all log entries will be displayed again.
Note in the figure above the entry named "Tabless": selecting this entry allows to show network requests not associated with any tab. Tabless request are denoted in the log by font shadow effect and 0 in "Context" column (fifth).

The big reload button aside the page selector is to force a reload of the content of the selected page. This button is enabled only for when a specific page is selected.
Click it with Ctrl, Shift or Cmd (Mac) to bypass cache.

Complementary tool to the element picker.
Please read more on dedicated page: "DOM inspector"

By clicking this button you can access the popup UI of a specific tab.

By default log entries in the logger are collapsed so as to take no more than one line. Some log entries however might be truncated as a result. This button can be used to expand all entries vertically to larger number of lines (configurable in Settings dialog, default 4) making them more visible.

With "All" selected in "Page selector" if you close a tab for which there are entries in the logger, these entries will be marked as void, i.e. they will be faded out, to indicate the tab for these entries does not exist anymore.
The X button in the toolbar allows you to remove those void entries from the logger.

This is to clear the logger, to remove all entries from the selected/filtered context (Ars Technica tab in this example).
Tabless request (faded out) may also appear in current page log. To clear them out, click Clear icon second time.


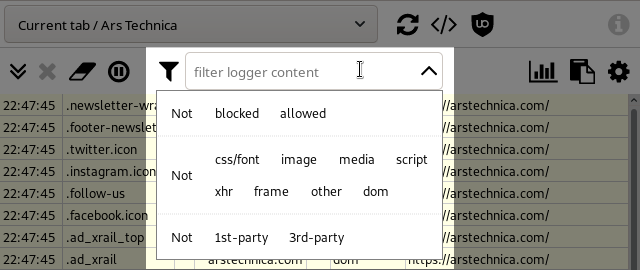
You can visually filter entries in the logger using filter expressions. Expressions can be chosen from expression picker, available by hovering mouse cursor over filter input box. Log entries which do not match all filter expressions will be hidden from view.

Clicking on arrow in the filtering input box deactivates expression picker.

Funnel icon toggles on/off current filter expression.
Filter can also be entered manually. Supported sytax:
- Enter
footo only show entries which have a stringfoo. - Enter
|footo only show entries which have a field starting withfoo.- Tip: use
|--to show only entries which were blocked (--may work for the most part, but there could be false positives).
- Tip: use
- Enter
foo|to only show entries which have a field ending withfoo. - Enter
|foo|to only show entries which have exactly a field withfoo. - Prefix any expression with
!to reverse the meaning of the expression.-
!foomeans display only entries which do not have the stringfooin it. -
!|--means display only entries which were not blocked.
-
- When more than one filter expression appear, a logical and between the expressions is implied.
- You can or multiple expressions together:
-
css || imagemeans display entries which match eithercssorimage. -
xhr || other |http:means display entries which match eitherxhrorotherand have a field which starts withhttp:. -
!css || imagemeans display entries which do not match eithercssorimages(equivalent to!css !imagereally). - Warning: With or'ed expressions, the not (
!) operator can only apply to the resulting or'ed expression.
-
- Enclose expression in slash
/characters to treat it as Regular Expression.
Examples:
-
!|-- facebook: show only non-blocked entries with the stringfacebookin it. -
|xhr google: show only entries of typeXMLHttpRequestwith the wordgooglein it. -
!|image !|css: show only entries which are not of typeimage, neithercss.

The current implementation reports statistics for all static filters, and the presentation/feature set is intentionally minimal: Do not open issues about this. It's still a work in progress and it will be worked on slowly and thoughtfully over time and as time allows.
Pausing the logger will not pause the collation of filter hit statistics, thus it is possible to lower the logger overhead by pausing logger output without losing filter hit collation.


Allows to easily export log to the system clipboard in format compatible with various discussion boards.


You can find out from which filter list(s) a static filter originates, by simply clicking on it (or in any other highlighted column):


- Clicking on filter list name will open assets viewer with content of that list.
- Home icon next to the filter name will bring you to the support site for that list.

Clicking on the highlighted cell of the log entry will give you access to the filtering tools dialog (modal), from where you can easily create dynamic URL filtering rules or just standard static filters.

Point-and-click to create dynamic URL filtering rules. These rules are temporary by default - click the padlock button if you want to make them permanent. Pressing Ctrl (Cmd on Mac) when setting rules will make them permanent immediately. Useful to find out which network requests need to be blocked or allowed on a page in order, to fix a broken page, or to further block more useless resources from a page.
See "Overview of uBlock's network filtering engine: details" for more details about where dynamic URL filtering fits in the overall filtering engine.

This dialog will assist you in creating static filters compatible with ABP filter syntax. Note that creating static filters incur a significant overhead relative to dynamic URL filtering rules. Typically, you will first use dynamic URL filtering rules to quickly diagnose which network requests need to be allowed/blocked.
See "Overview of uBlock's network filtering engine: details" for more details about where static filtering fits in the overall filtering engine.
uBlock Origin - An efficient blocker for Chromium and Firefox. Fast and lean.
- Wiki home
- About the Wiki documentation
- Permissions
- Privacy policy
- Info:
- The toolbar icon
- The popup user interface
- The context menu
-
Dashboard
- Settings pane
- Filter lists pane
- My filters pane
- My rules pane
- Trusted sites pane
- Support
- Keyboard shortcuts
- The logger
- Element picker
- Element zapper
-
Blocking mode
- Very easy mode
- Easy mode (default)
- Medium mode (optimal for advanced users)
- Hard mode
- Nightmare mode
- Strict blocking
- Few words about re-design of uBO's user interface
- Reference answers to various topics seen in the wild
- Overview of uBlock's network filtering engine
- uBlock's blocking and protection effectiveness:
- uBlock's resource usage and efficiency:
- Memory footprint: what happens inside uBlock after installation
- uBlock vs. ABP: efficiency compared
- Counterpoint: Who cares about efficiency, I have 8 GB RAM and|or a quad core CPU
- Debunking "uBlock Origin is less efficient than Adguard" claims
- Myth: uBlock consumes over 80MB
- Myth: uBlock is just slightly less resource intensive than Adblock Plus
- Myth: uBlock consumes several or several dozen GB of RAM
- Various videos showing side by side comparison of the load speed of complex sites
- Own memory usage: benchmarks over time
- Contributed memory usage: benchmarks over time
- Can uBO crash a browser?
- Tools, tests
- Deploying uBlock Origin
- Proposal for integration/unit testing
- uBlock Origin Core (Node.js):
- Troubleshooting:
- Good external guides:
- Scientific papers